Dado Bruto = “raw data” in Portuguese. Independent data and news about Brazil
Elections 2026 · Runoff · Municipal profile
Brazil's vote map is less divided by income than in 2018
We matched the 2018, 2022 and 2026 presidential runoffs with the 2022 Census across 5,570 municipalities. Between the poorest and the richest fifth of the electorate, the gap in the Workers' Party vote fell from 41 to 23 points. Bolsa Família, religion and race still divide municipalities; income and farming, less and less.
In 2018, in the municipalities that make up the poorest fifth of Brazil's electorate, Workers' Party (PT) candidate Fernando Haddad won 74.9% of the valid runoff votes; in those that make up the richest fifth, 34.1%. That was a 40.8-point gap. In 2022, Lula got 72.7% and 45.6%: 27.1 points. In 2026, 71.2% and 48.1%: 23.2 points.
Income still divides the vote, but less each time. And the curve turned into a U: the richest municipalities, nearly all big cities and state capitals, gave Lula more votes than upper-middle-income ones. This analysis matches the runoff results in 5,570 municipalities with 2022 Census data (income, education, religion, race, age, urbanization, work) and with the Bolsa Família cash-transfer program.
It compares municipalities, not voters. That more evangelical municipalities voted less for Lula does not mean each evangelical voted for Flávio Bolsonaro. Nothing here shows cause.
The poorer the municipality, the bigger the PT vote; the gap has narrowed since 2018
PT candidate's share of valid runoff votes, by municipal income quintile
Splitting municipalities into five groups with the same number of valid votes, the largest gaps show up for Bolsa Família and race: Lula got 36.5% where there are fewest benefits per household and 71.0% where there are most; 37.7% where Black and pardo people are fewest and 65.8% where they are most. In the least evangelical municipalities, 62.7%; in the most evangelical, 45.2%.
Education and urbanization follow the same U as income: Lula's share falls from the first to the third or fourth group and rises again in the last, driven by the state capitals. By region, Lula got 69.4% in the Northeast, 50.0% in the North, 47.2% in the Southeast, 40.0% in the Center-West and 37.4% in the South.
Lula's 2026 vote by group of municipalities
Each chart splits municipalities into five groups with 1/5 of valid votes each, from the lowest (1) to the highest (5) value of the variable
All together: what remains when the variables move together
Income, education, Bolsa Família and region move together: poorer municipalities have more Bolsa Família, fewer graduates and are more often in the Northeast. To separate a little what each one says, we put them all in one model, comparing only municipalities within the same state (state fixed effects) and weighting each by its valid votes.
The state alone accounts for 66% of the differences in the vote across municipalities; with the Census variables, 84%. In the full model, the strongest associations are the share of Black and pardo people (+9.3 points per standard deviation), Bolsa Família (+6.6) and evangelicals (−4.4). Two flip sign: education, which alone is linked to a lower Lula vote (−2.9), goes to +2.9 once income enters the model; agriculture goes from +4.9 to −1.6.
Alone and with the others: how each variable's association with the Lula vote changes
Regression weighted by valid votes, with state fixed effects; income and GDP per capita in logs. Hollow circle: the variable alone. Filled circle: with all the others and the state. Source: TSE (2018, 2022 and 2026 runoffs); IBGE, 2022 Census; MDS (Bolsa Família, Dec. 2025). Calculations: Dado Bruto.
2018, 2022, 2026: the gaps narrowed
Running the same calculation for the three runoffs (with the 2022 Census in all three), the association of income with the PT vote fell from −12.9 to −7.8 points per standard deviation; that of agriculture, from +11.1 to +4.9; that of Bolsa Família, from +19.6 to +13.4. Evangelicals changed less: from −9.2 to −7.2. In 2018 the PT candidate was Haddad; in 2022 and 2026, Lula. And the 2026 opponent was not the same as in 2018 and 2022.
How strongly each variable is associated with the PT vote, election by election
Slope of the weighted regression of each variable alone (points of PT share per standard deviation). Red: associated with a higher PT vote; blue: with a lower one. Source: TSE (2018, 2022 and 2026 runoffs); IBGE, 2022 Census; MDS (Bolsa Família, Dec. 2025). Calculations: Dado Bruto.
From 2022 to 2026: where Lula's share rose and where it fell
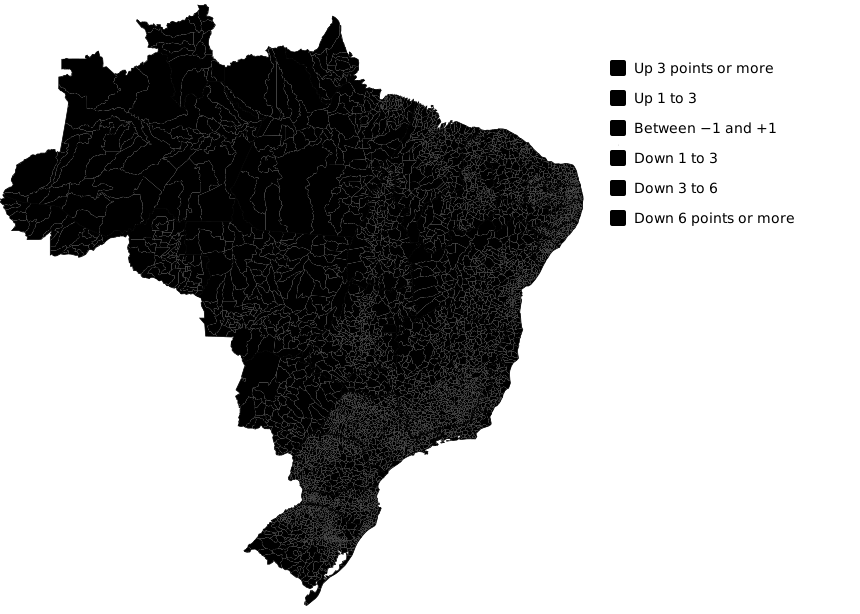
Lula's share fell from 2022 in most municipalities and still rose nationwide, from 50.9% to 51.8%, because the gains came from big cities. The profile adds another layer: the share fell more where more people work in agriculture and rose in the most urban municipalities.
In the fifth with the most farm work, Lula's share changed −2.1 points; in the fifth with the least, +2.6. By urbanization, −2.1 in the least urban fifth and +2.9 in the most urban. With all variables and the state in the model, agriculture is still the strongest association with the decline (−0.93 points per standard deviation).
Where farm work is larger, Lula's share fell more
Points of Lula share, 2026 minus 2022, adding up the votes in each group. Source: TSE (2018, 2022 and 2026 runoffs); IBGE, 2022 Census; MDS (Bolsa Família, Dec. 2025). Calculations: Dado Bruto.
In the most urban municipalities, Lula's share rose
Points of Lula share, 2026 minus 2022, adding up the votes in each group. Source: TSE (2018, 2022 and 2026 runoffs); IBGE, 2022 Census; MDS (Bolsa Família, Dec. 2025). Calculations: Dado Bruto.
Where Lula's share rose and fell from 2022 to 2026
Runoff, percentage points of valid votes, by municipality
Source: TSE, 2022 and 2026 runoffs; municipal boundaries: IBGE. Calculations: Dado Bruto.
Outliers
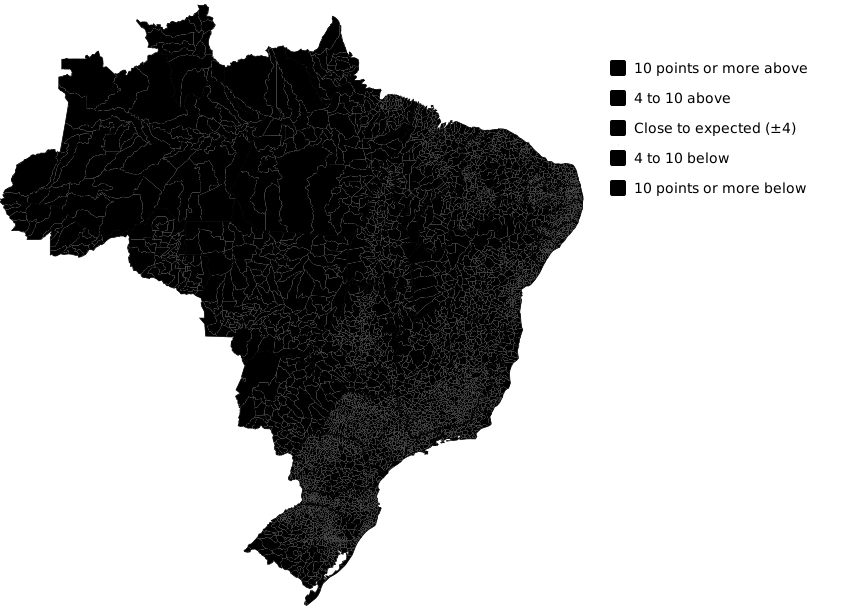
The model gives, for each municipality, the Lula vote its Census profile and state would suggest. Most land close to that. Some groups stand out: municipalities in Amazonas, such as those in the Upper Solimões, gave Lula far more than expected; municipalities in Pará along the Trans-Amazonian Highway and the BR-163, and in the hills and north of Rio Grande do Sul, far less. The numbers show where the gap is, not why it exists.
Where Lula did better or worse than the municipality's profile would suggest
Gap between the actual and the expected vote, in percentage points
Weighted logistic model with 2022 Census variables, Bolsa Família and state fixed effects. Source: TSE; IBGE; MDS. Calculations: Dado Bruto.
The 15 furthest above expected (municipalities with 20,000 people or more)
Municipality
Population (2022)
Lula, %
Expected, %
Gap
São Gabriel da Cachoeira (AM)
51,795
80.0
42.8
+37.2
Santo Antônio do Içá (AM)
28,211
74.1
42.5
+31.6
São Paulo de Olivença (AM)
32,967
83.4
55.6
+27.8
Benjamin Constant (AM)
37,648
81.3
59.7
+21.6
Tabatinga (AM)
66,764
67.9
48.2
+19.7
Itaperuçu (PR)
31,217
55.8
36.2
+19.6
Oiapoque (AP)
27,482
63.8
44.9
+18.9
Barreirinha (AM)
31,051
90.9
72.3
+18.6
Ortigueira (PR)
24,192
52.9
34.7
+18.1
Tabuleiro do Norte (CE)
30,652
80.1
62.3
+17.9
Cataguases (MG)
66,261
62.0
44.3
+17.7
Capão do Leão (RS)
26,487
54.3
36.7
+17.7
Barcarena (PA)
126,650
65.1
47.6
+17.5
Macau (RN)
27,369
79.7
63.0
+16.7
Rio Grande (RS)
191,900
63.9
47.4
+16.5
The 15 furthest below expected (20,000 people or more)
Municipality
Population (2022)
Lula, %
Expected, %
Gap
Uruará (PA)
43,558
21.7
47.9
−26.2
Pacajá (PA)
41,097
30.5
56.5
−26.1
Marco (CE)
25,799
57.7
81.4
−23.7
Rurópolis (PA)
35,769
29.0
52.2
−23.2
Anapu (PA)
31,850
29.0
52.0
−22.9
Novo Progresso (PA)
33,638
15.7
38.5
−22.8
Tapejara (RS)
24,557
22.0
44.5
−22.4
Morrinhos (CE)
22,753
52.4
74.4
−22.0
Nova Prata (RS)
25,692
21.6
43.1
−21.5
Medicilândia (PA)
27,094
27.1
48.4
−21.3
Pompéia (SP)
20,196
26.2
47.0
−20.8
Mojuí dos Campos (PA)
23,501
36.3
57.0
−20.7
Veranópolis (RS)
24,021
19.8
40.0
−20.2
Flores da Cunha (RS)
30,892
16.6
36.4
−19.8
Taiobeiras (MG)
33,050
41.6
61.0
−19.4
Expected: the Lula vote the model (2022 Census profile, Bolsa Família and state) would suggest. Gap in percentage points.
Robustness: the full model in different subsets
Subset
Bolsa Família
Evangelicals
College
Income
Agriculture
All municipalities
+6.6
−4.4
+2.9
−3.3
−1.6
Only above 20,000 people
+8.0
−4.8
+2.8
−2.9
−2.2
Without state capitals
+4.6
−3.6
+3.3
−7.3
−1.4
Unweighted
+3.9
−2.5
+2.0
−6.2
−1.0
North
+7.9
−2.5
+4.6
−13.4
−0.2
Northeast
+3.0
−5.6
+1.0
−4.3
−0.6
Center-West
+7.8
−1.3
+3.0
−6.6
−1.8
Southeast
+6.7
−4.9
+2.3
+0.2
−0.3
South
+15.0
−2.3
+2.5
−1.9
−2.8
Points of Lula share per standard deviation, with all variables and state fixed effects. Bolsa Família (+), evangelicals (−) and college (+) keep their sign in every subset; income varies a lot from region to region.
Method and limits
Data. Runoff votes in 2018 (Haddad × Jair Bolsonaro), 2022 (Lula × Jair Bolsonaro) and 2026 (Lula × Flávio Bolsonaro), from Brazil's Superior Electoral Court (TSE), by municipality, excluding votes abroad. Profile: IBGE's 2022 Census (household income per capita, education of people aged 25 or over, religion of people aged 10 or over, race, age, urban population, informal and farm work), 2023 municipal GDP per Census resident, and Bolsa Família benefits in December 2025 per 100 households (Ministry of Social Development, via Ipeadata). 5,570 municipalities; Boa Esperança do Norte (Mato Grosso), created after the Census, is left out.
Groups. Quintiles split municipalities into five groups with the same number of 2026 valid votes; each group's share is the sum of its votes, not the average of its municipalities.
Models. Linear regression weighted by valid votes, with standardized variables, state fixed effects and robust errors; income and GDP per capita in logs. Variance inflation factors: income 9.9, Bolsa Família 6.1, informal work 5.0; the rest below 4. With such correlated variables, each coefficient is unstable and should not be read as an effect. For expected values and gaps, we used a regression on the logit of Lula's share, which keeps predictions between 0% and 100%.
Limits. A comparison of municipalities, not people (ecological fallacy). The Census is from 2022; the vote, from 2026 (and 2018). Different candidates in each election. No relationship here is causal.
You may reuse this. The charts and data in this analysis may be copied and republished, even commercially, under the CC BY 4.0 license. Just credit “dadobruto.com” and, online, link to this page or to dadobruto.com. The original numbers follow the rules of each cited source. The text of the analysis is outside the license.
How to cite:Dado Bruto. Brazil's vote map is less divided by income than in 2018. Code DB-AN-0014. Published Oct. 28, 2026. https://dadobruto.com/en/analysis/brazil-2026-runoff-vote-by-municipal-profile
None of the 51 polls released between Brazil's two rounds reached Lula's 51.79% runoff result. In 16 of 20 final polls, the miss exceeded the pollster's own margin of…
Lula received 51.8% of the valid votes and Flávio Bolsonaro, 48.2%, with 99.8% of polling stations counted. Seven charts show where the vote changed from the first…
Lula received 45.2% of the valid votes and Flávio Bolsonaro, 47.0%. We compared 5,570 municipalities with 2022 and 2018 to show where the difference was built, where it…